graphs of performance analytics on a laptop screen
a close up of a window with a building in the background

Projets récents

J’ai accompagné des leaders industriels et technologiques dans la transformation de leurs données en leviers stratégiques.
Parmi eux :

  • Airbus Helicopters – Refonte complète des workflows SharePoint & Nintex, pilotage de projets Service Desk, création d’outils de reporting Power BI.

  • Gunvor (Trading, Suisse) – PMO central, suivi budgétaire de 7,9M$, déploiement de SharePoint à l’échelle corporate.

  • Eurenco – Coordination d’un projet de 120M€, réduction des coûts de 20%, mise en place de KPIs et reporting stratégique.

  • Caterpillar (Suisse) – Migration Windows, support VIP, déploiement SharePoint.

  • Novartis (Suisse) – Migration Lotus vers SharePoint, création de workflows et documentation technique.

  • Ergo Group (Norvège) – Tests bancaires, qualité logicielle, support applicatif.

  • GEMS (Irlande du Nord) – Support EMEA Cisco, gestion technique en environnement international.

  • Renova9 – Coordination de chantiers, gestion opérationnelle et budgétaire.
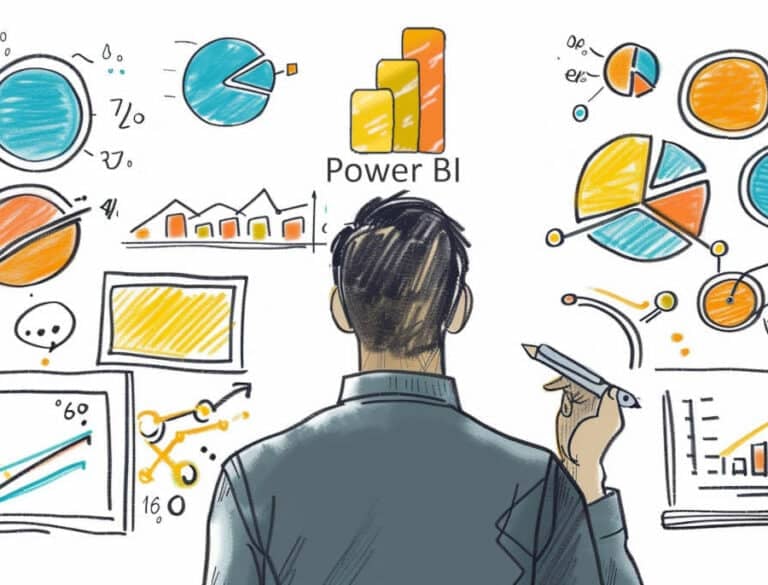
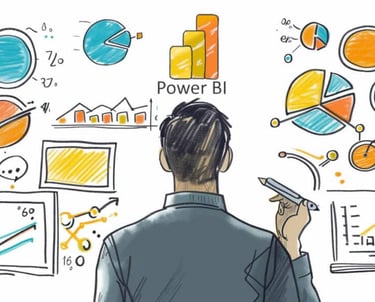
An abstract, pastel-colored, 3D-rendered representation of data analysis and search engine optimization (SEO). The image features a computer interface with various analytics symbols, including a magnifying glass, bar charts, pie charts, and a search bar with the text 'SEO'. Surrounding the interface are different objects such as a potted plant, a cup with a saucer, and a megaphone, all placed on a light green background.
Tableaux de bord

Création de visualisations interactives et performantes, permettant aux utilisateurs d'explorer des données de manière intuitive et engageante. Ces visualisations facilitent la compréhension des tendances et des patterns complexes, en transformant des ensembles de données bruts en éléments visuels clairs et informatifs, favorisant ainsi une prise de décision éclairée.

A person is looking at a computer screen displaying a document titled 'Overview - All Private Equity - Fundraising, Investments, & D'. The document contains statistical charts and graphs related to private equity market statistics from 2007 to 2022. Various tabs and functions like 'File', 'Home', 'Insert', and 'Design' are visible in the interface.
Detailed map displaying data visualization with blue circular markers representing specific data points across a geographical area labeled with city names such as Lisbon and Evora. Bold, brightly colored numerical statistics appear on the left side with the terms 'Suspeitos' and 'Amostras,' suggesting a context of data tracking or analysis.
A laptop displays a detailed financial chart with lines showing data trends. In the background, a person is partially visible, wearing a dark shirt with the words 'most valuable' and some logos printed on it. The setting appears to be a modern workspace.
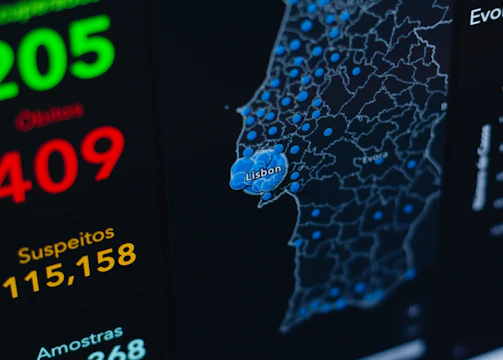
Optimisation des données
  • 💼 Reporting RH dynamique : suivi du turnover, des formations et des recrutements

  • 💰 Dashboard de performance financière : visualisation des indicateurs clés et comparatif budgétaire

  • 📦 Suivi logistique : flux de livraisons, gestion des stocks et alertes de seuil